
Preface:
The threshold value of the logistic regression decides the four values of the confusion matrix. As a result, it becomes difficult to choose a suitable threshold value. Therefore to avoid an overwhelming number of confusion matrices, we use ROC(Receiver Operator Characteristics) and AUC(Area Under Curve) graph.
What is the ROC graph?
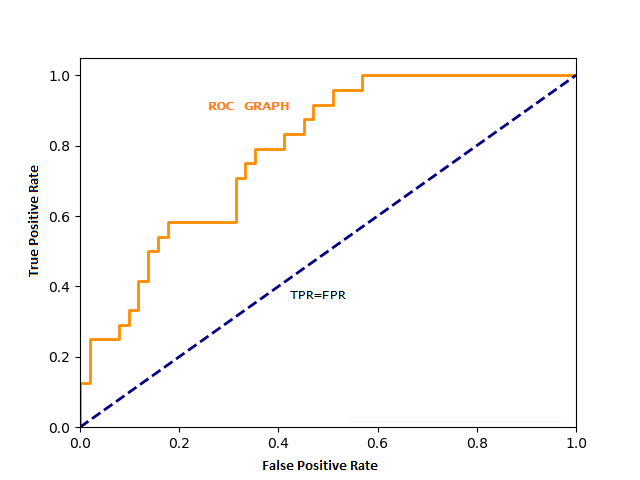
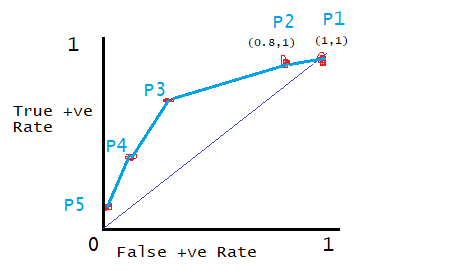
ROC is a simple line graph that helps the user to summarise all the information about the threshold value. In the ROC graph, Y-axis represents sensitivity, also known as the True-Positive Rate and X-axis represents 1-Specificity, also known as False-Positive rate. The orange line in the picture above is a ROC line. Different values of sensitivity and specificity generate ROC. Any point that is nearer to Y-axis will be considered as a good threshold.
What is the True-Positive rate and False-Positive rate?


True-Positives are the correct predictions of LR. In other words, these are the scenarios where the patient is having a disease and the model has predicted correctly. Similarly, false-negatives are the wrong predictions of LR. In other words, these are cases where the patient is having disease and model predicted no disease. Hence, the true-positive rate(TPR) is what proportion of patient with the disease and correctly identified by the machine.

False-positives are the predictions of the model where the model predicted the patient is having a disease but in reality no disease. Similarly, in the case of true-negatives, the model predicted the patient doesn’t have any disease and in reality it’s true. Hence, the false-positive rate(FPR) means the proportions of ‘no-disease’ cases that are predicted as ‘with-disease’ cases.
Relationship of threshold value with TRP and FPR:
When the threshold value is very low, any light symptoms in a patient will trigger the model to classify the patient as positive. In other words, the model predicts most of the cases are to be positive (True-positive and False positive). As a result, TPR and FPR are almost equal, which falls on the blue diagonal line.
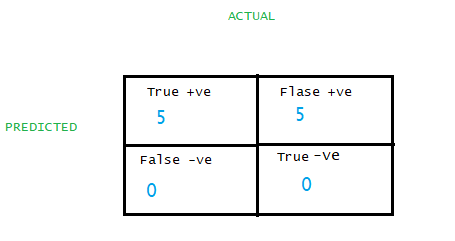
TPR(Sensitivity) =TP/(TP+FN)=5/(5+0)=1, this means every single patient is correctly classified.
FPR(1-Specificity)=FP/(FP+TN)=5/(5+0)=1, this means every single patient with no disease is classified as positive. So, in the above case TPR and FPR both are one. Therefore point falls on the diagonal line. A point on the blue diagonal line means the percentage of the patient that is correctly classified with the disease is the same as the percentage of a patient incorrectly classified as with disease(actually the patient does not have any disease).
When we increase the threshold value such that almost all the patients classified positive except those who do not have any symptoms.
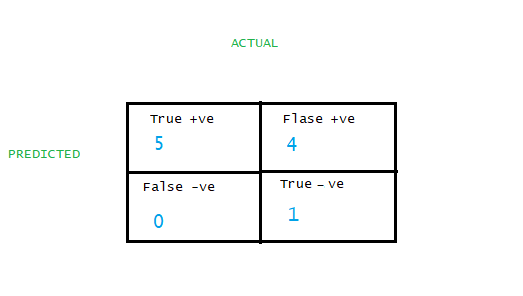
If we put the data in the formula from the above table:
TPR=TP(TP+FN)=5/(5+0)=1. TRP is Y axis
FPR=FP(TP+FN)=4/(4+1)=0.8 FPR is X axis.
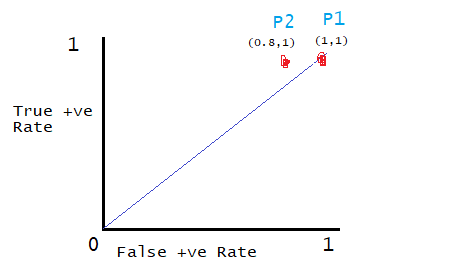
We can observe from the above graph that P2 is a better threshold than P1. As derived from the formula above the value of TPR is greater than FPR.
By adjusting the threshold value, we can generate points for each threshold. After getting a few points, we can join those points, which ultimately becomes the ROC curve. The area under the ROC curve is known as the Area Under Curve(AUC). An ideal threshold would be a point where TRP is greater than FPR.
Conclusion: Roc and Auc graph helps the user to determine a suitable threshold without compromising false positives.
What is the AUC graph?
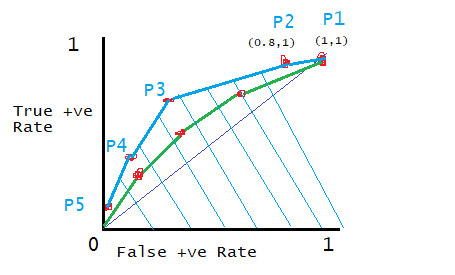
AUC is the area under the ROC curve. For different classification, models produce different ROC curves. Therefore, AUC for different models varies. The models with the largest AUC is considered better than other models. For example, logistic regression produces the blue curve and random forest produces a green curve. From the figure, we can observe that LR is better than RF as LR cover more area than RF.
Where we need a low threshold and where we need a high threshold?
Low Threshold scenarios: Bank security software, disease detection are some examples where we are least bother about false-positives.
High Threshold scenarios: Food quality test, spam detection are some scenarios where one has to more concerned about high True-Positive cases.