

Preface:
In the field of machine learning, there are two types of problems in terms of results: regression problem and classification/multi-class problem. The ultimate goal of every machine learning engineer is to reduce errors.
Therefore, all type of machine learning problem has its measure to quantify error. For the regression problem, the goodness of the model is measured by Mean Squared Error and Root Mean Squared Error. Similarly, the goodness of classification is measured with the help of a confusion matrix (cm). Note: CM paves the way to calculate some of its derivative measures.
What is the confusion matrix?
As the name suggests, it is a matrix. The most fundamental form is of two rows and two columns (2X2), where columns are Actual Values and rows are Predicted values. The picture below shows a confusion matrix:
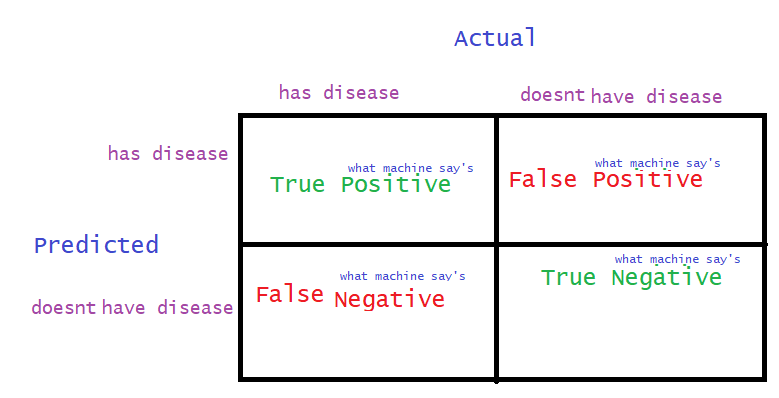
Now, we shall decode the above matrix step by step. We have taken a situation where there is a patient of any disease and there is a machine (think it’s an ML model).
The first columns say the patient has the disease. The second columns say the patient doesn’t have the disease. Likewise, the first row says ‘machine has predicted: the patient has disease ‘. The second row says, ‘machine has predicted: the patient doesn’t have the disease’.
Breaking up the Confusion Matrix:
All total there are four terms, those are: ‘True Positive’, ’True Negative’, ‘False Positive’, ’False Negative ’. The term ‘True Positive ’ means the machine has predicted a patient has a disease and actually he/she has a disease. Here ‘True’ means the machine’s prediction is correct.
Therefore, the second word of the term, ’Positive’ or ‘Negative’ is the prediction of the machine. The first word of the term, ‘True’ or ‘False’ is the correctness of the prediction.
Let’s take another example, ’False Negative’ means Machine predicted patients do not have a disease and the prediction is wrong (False). Well, it’s dangerous for someone is having a disease and the machine is saying ‘no disease’.
Similarly, ‘False Positive’ means Machine predicted a patient has a disease but actually there is not disease.
As you can observe, we have to be very careful while handling False Positives and False Negatives.
Here onwards we shall shift our focus on some of the metrics that are derived from cm.
What are Sensitivity and Specificity?
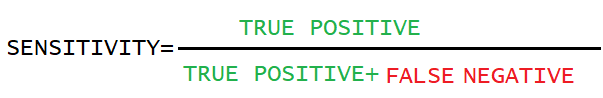
Sensitivity: In the first column of the cm, which contains the patients with the disease. Sensitivity is calculated as the percentage of patients with a disease that is correctly identified. In other words, if our priority is to identify positives then we should look for sensitivity. Sensitivity is also, what proportion of actual positives was identified correctly? Recall/sensitivity is very useful in fraud detection or disease detection. In the banking domain, let’s say an actual fraudulent transaction (actual positive) is predicted as non-fraudulent (predicted negative).
Similarly, in disease detection, if a sick patient(actual positive), after test, results show not sick(predicted negative). Then the penalty of miss classification is extremely high.
The formula for calculating Sensitivity is

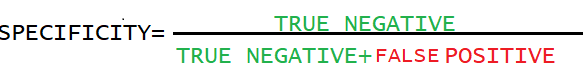
Specificity: The second column of the cm, which contains the patients who don’t have any disease. Specificity is the percentage of patients without disease that is correctly detected. In other words, if our priority is to identify negatives then we should look for specificity. Formula to calculate specificity is:
What are Accuracy and Precision?
Accuracy:
Accuracy in a normal sense is getting predictions close to the true value.
It is the percentage of correct predictions. It is derived by the total number of true predictions (TP+TN) divided by all predictions (TP+FN+FP+TN)
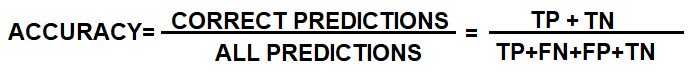
Accuracy is the measure of all the correctly identified predictions over all the predictions. However, there is a problem. Accuracy misses out False Negative (patient actually having the disease but machine predicted Negative) and False Positives. In these cases, the F1 score is used. Accuracy performs better when classes are equally distributed.
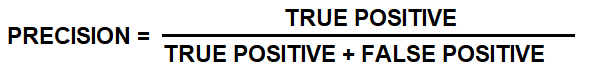
Precision:
Precision says, consistency in getting the same result in every trial. It should be considered when the cost of False Positive is high. For example, in email spam detection, a false positive means that an email is not spam but machine-classified it as spam. Similarly, a patient actually does not have a disease (true negative) but machine-classified it as positive.
What is the F1 score?

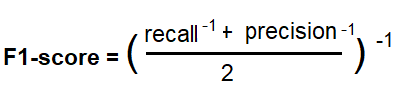
F1 score is the harmonic mean of Precision and Recall. The “harmonic mean” is used because it penalizes extreme values. F1 score should be used when more importance is given to False Negatives and False Positives. F1 score works better when classes are imbalanced.
Logistic Regression and Confusion Matrix:
Logistic regression(LR) in the simplest terms classifies data into two categories. One of the important components of LR is the threshold. The threshold value decides which data point will belong to which class.
An increase and decrease in threshold value change the values of the table. Our model failed to predict correctly in false-positive and false-negative metrics. Assume a situation, where we have to build an LR model that classifies a patient suffering from a disease or not. Let’s say we have kept the threshold value at 0.8. For this threshold, there will be n number of false-positive and m number of false-negatives.
Now, if we decrease the threshold value, the number of positive(both true and false positive ) cases will increase. Alternatively false-negative and true-negative will decrease. Why false-negative? As false-negative is a scenario where a patient has a disease and machine predicted no disease. It will be a very fatal case if we fail to diagnose the disease. In conclusion, we want to reduce false-negative cases. Hence the reduction of threshold values reduces the number of false-negative.
Later, we shall discuss, how to choose threshold value.
How it works in python:
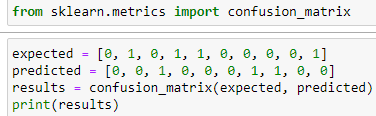
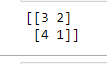
Results are:
According to scikit-learn documentation, where 0,0 position is True Negative, which is 3. (1,0) position is False Negative, which is 4. (1,1)position is True Positive, which is 1.( 0,1) position is False Positive, which is 2.